Objectives
-
Full Capable Data Collector Application
-
WMS - WFS Support
-
Binary File Upload (Image etc.)
-
User - Role Management
-
Statistics by User
-
Open Source
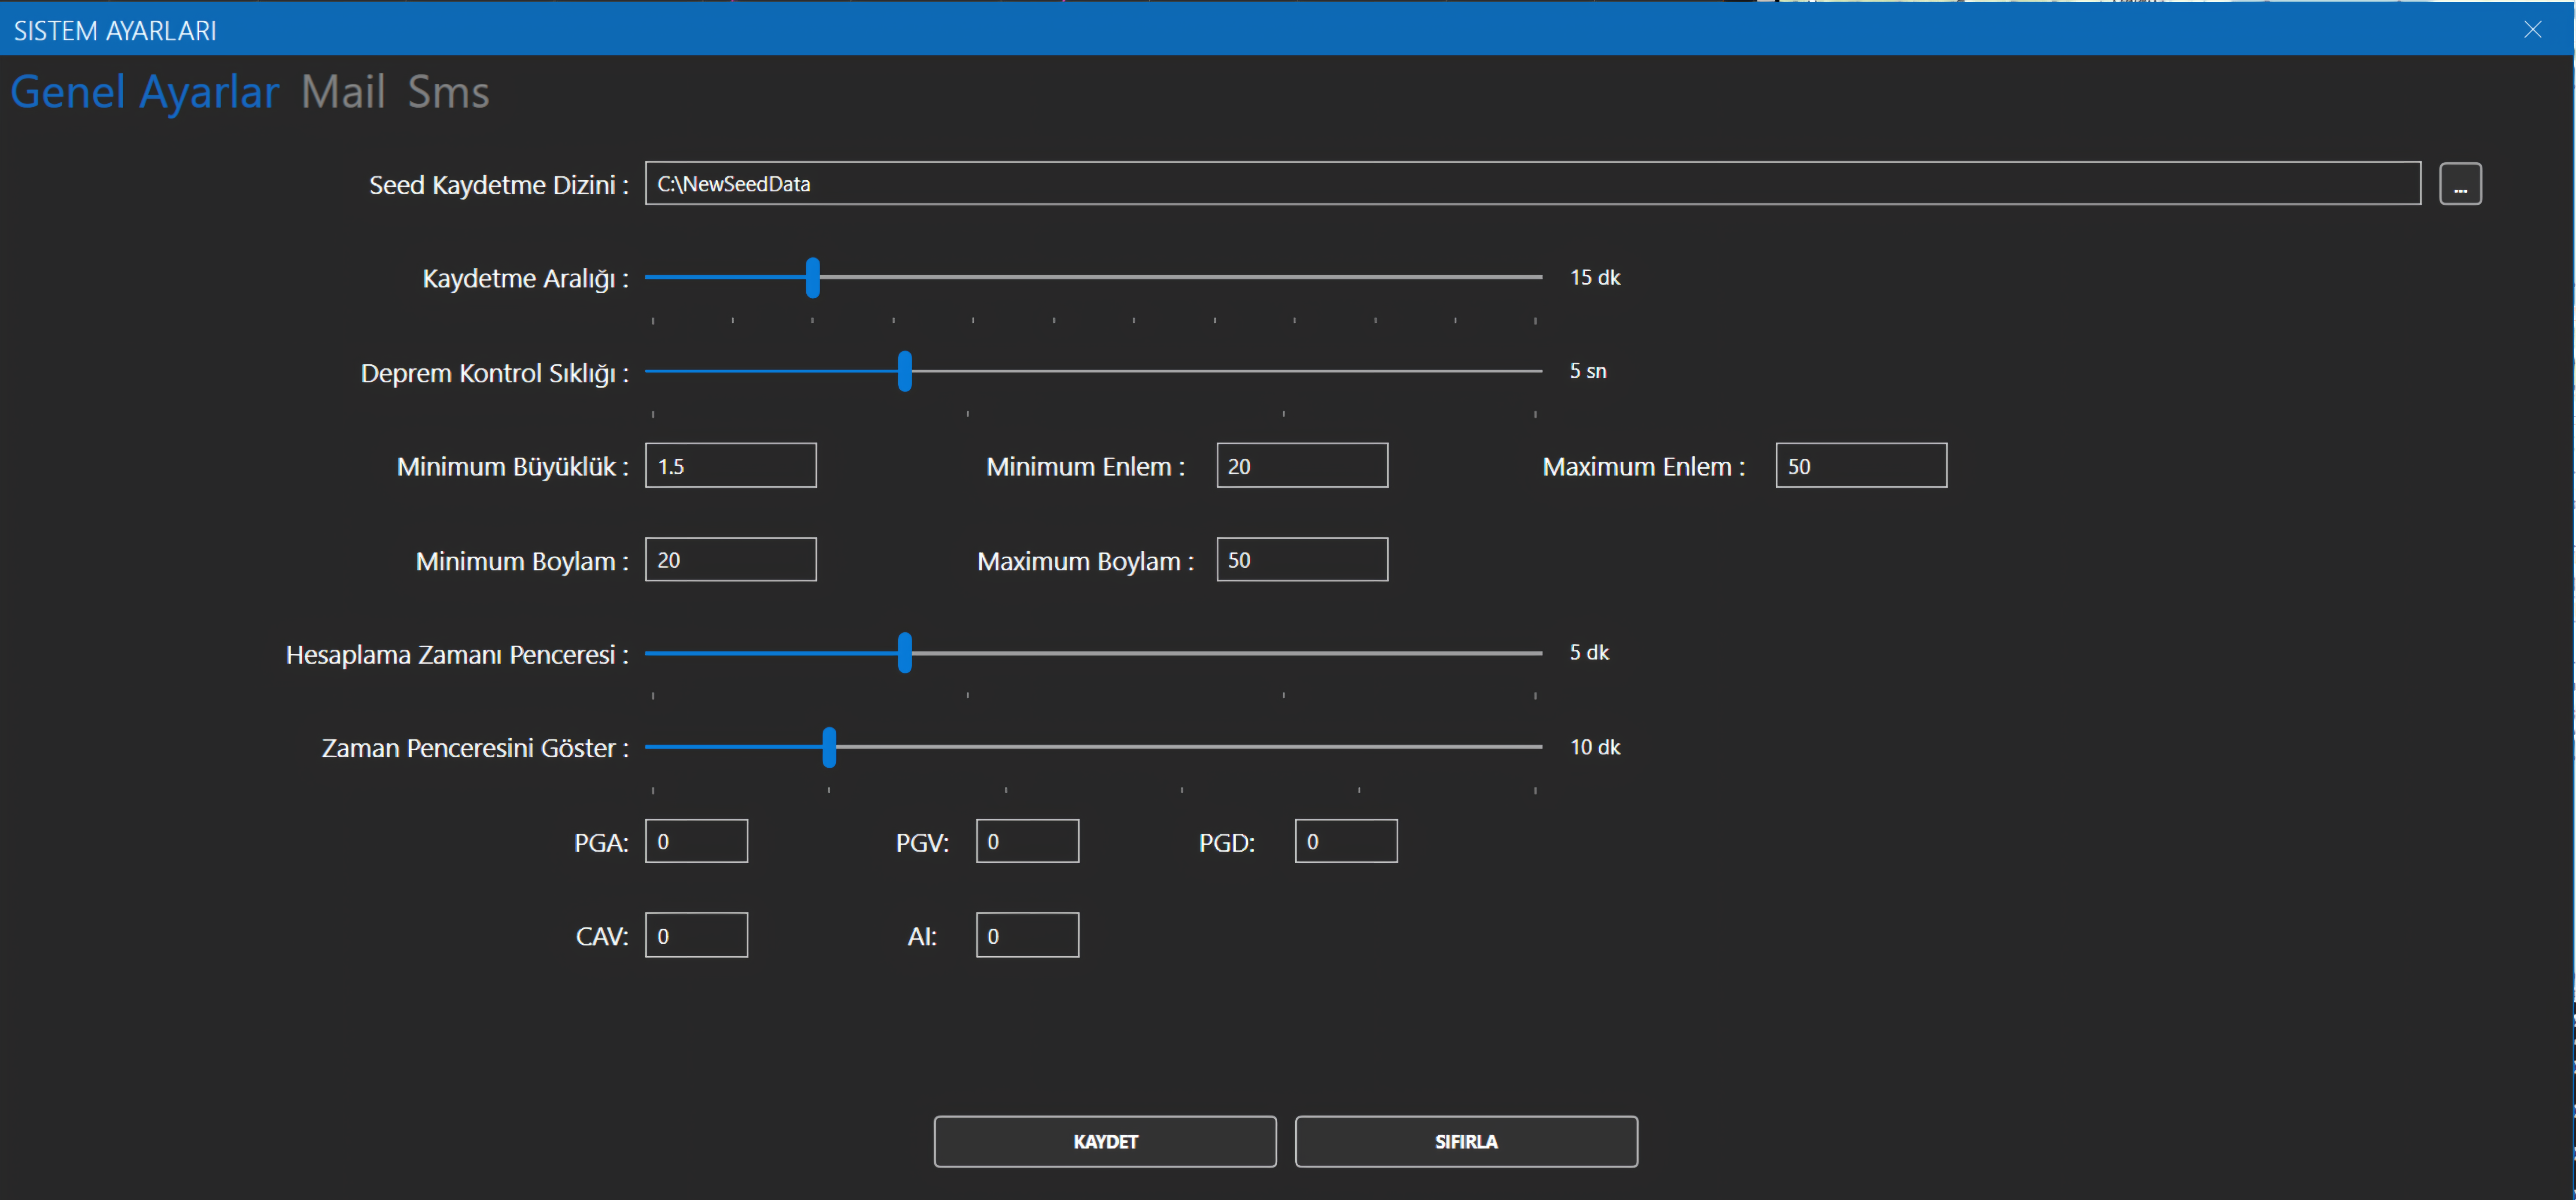
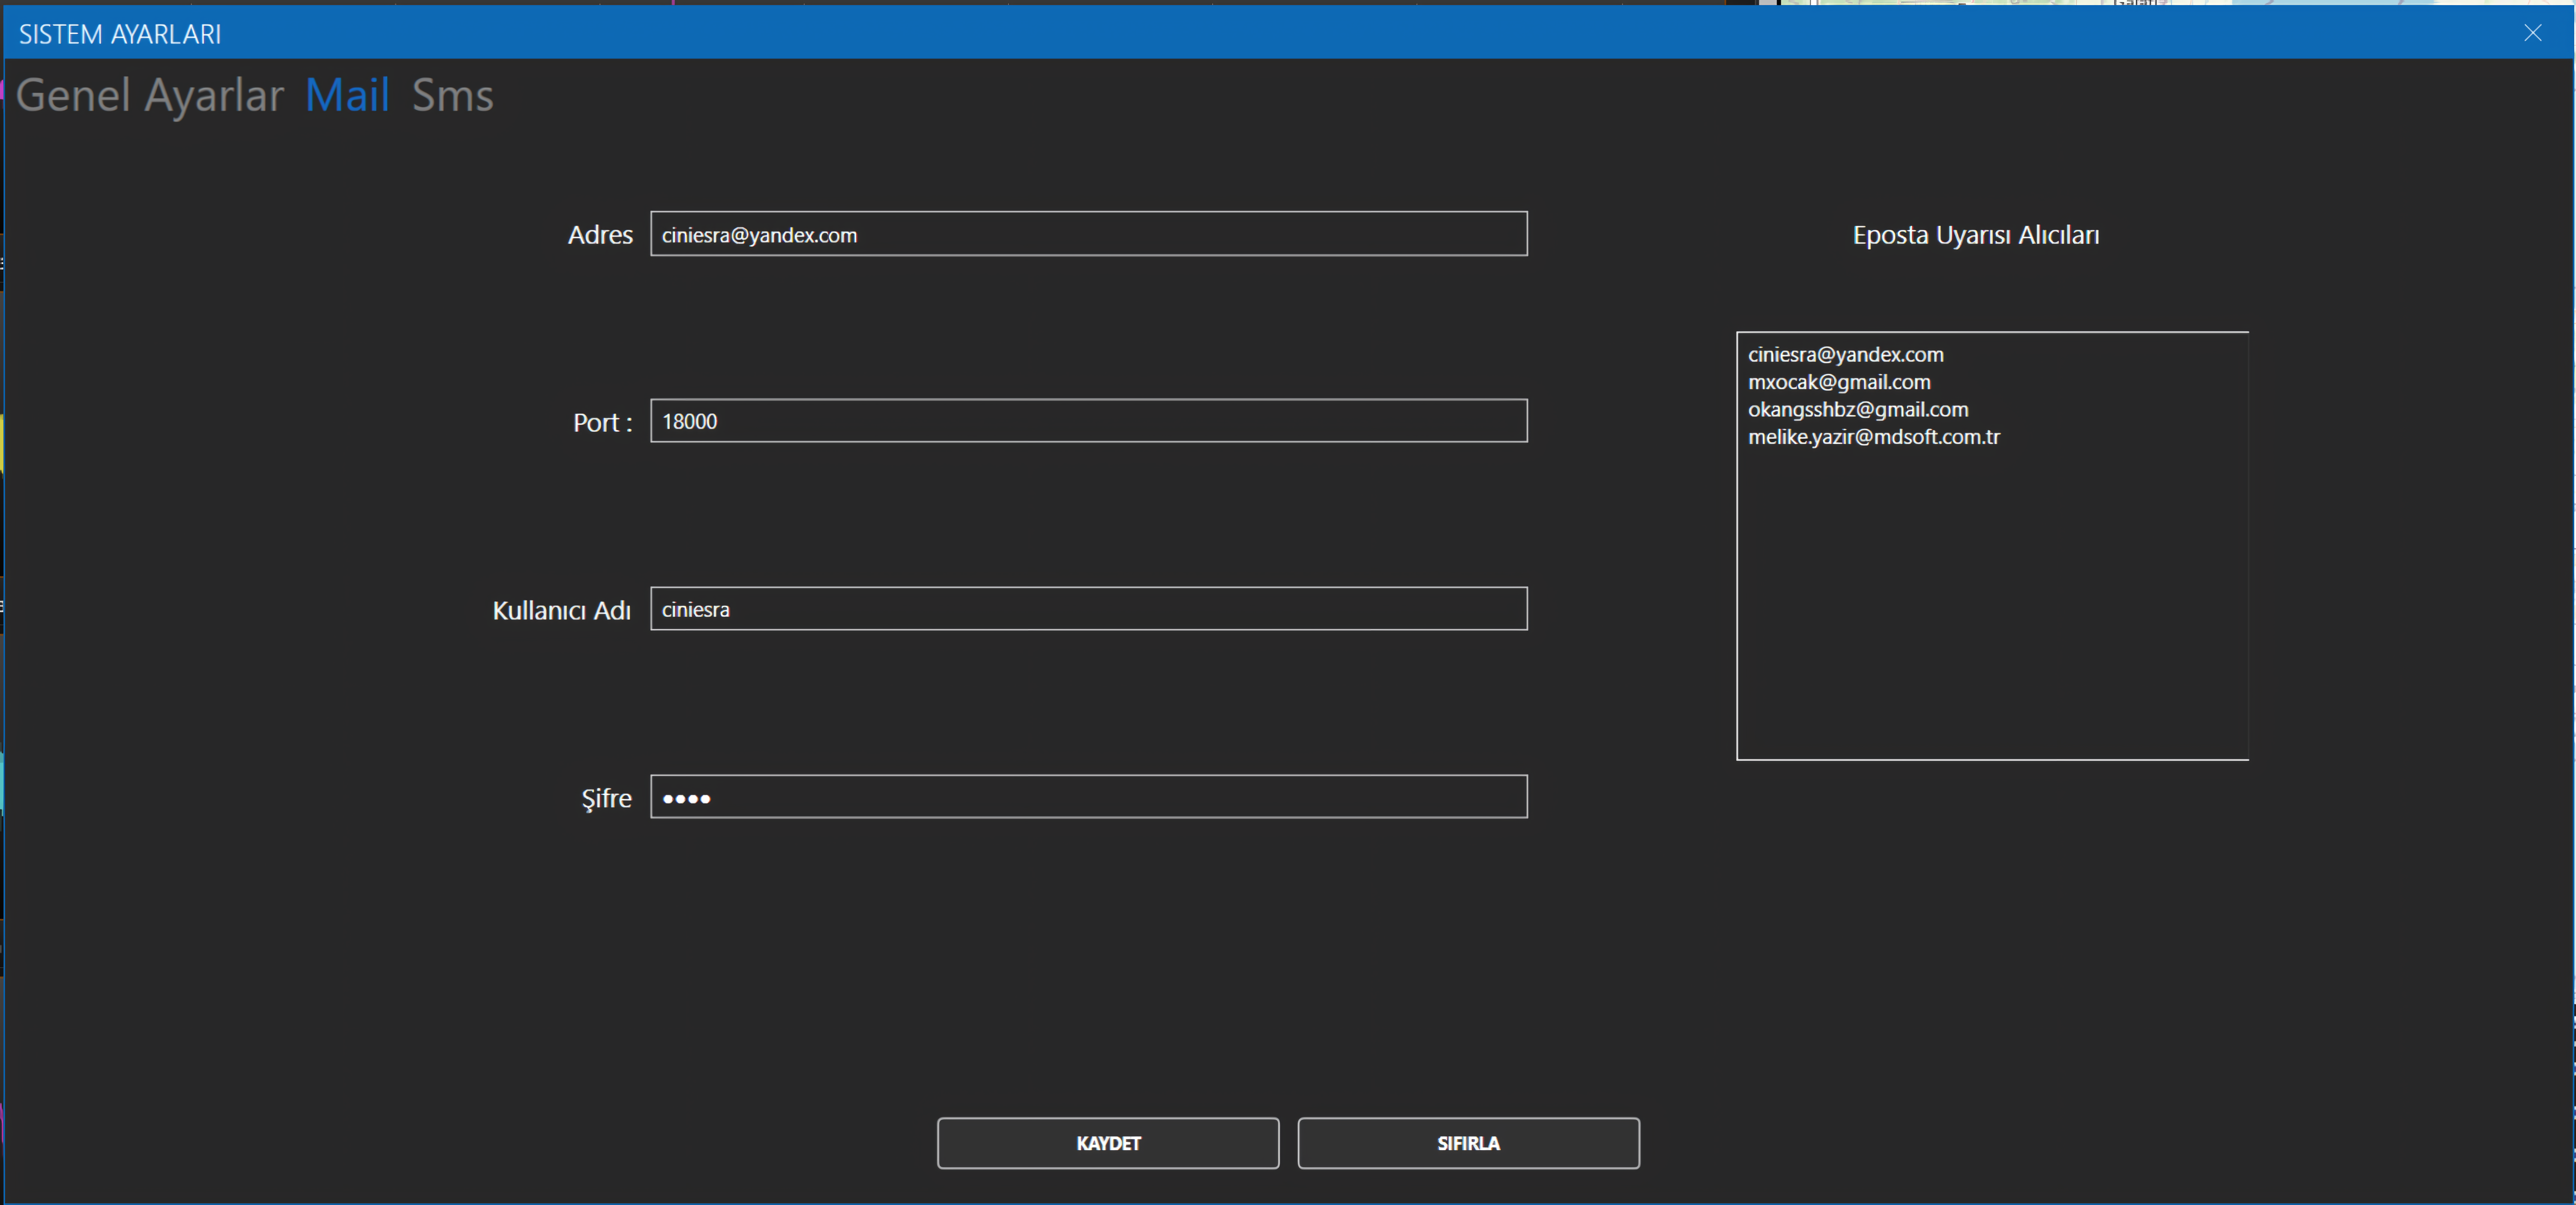
- The directory for saving mseed files, the time interval for archiving data, e-mail/SMS settings for SMTP, SMS Gateway, e-mail/Phone number lists of the recipients can be configured via the settings menu.
- Seismer checks the user-defined thresholds in terms of PGA,PGD,PGV, CAV, AI in real-time for informing the users. Both e-mail and SMS alerts are possible.
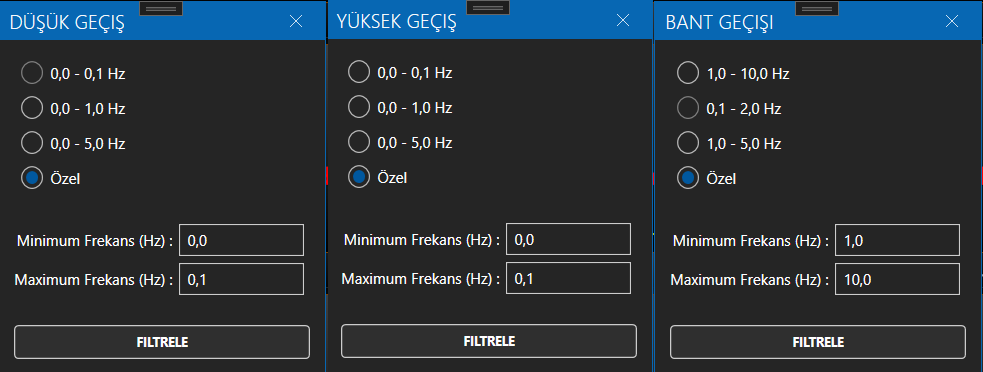
Real-time spectral filtering of incoming data is possible. High-pass, low-pass and band-pass filtering can be fine tuned with the user-friendly interface of Seismer.
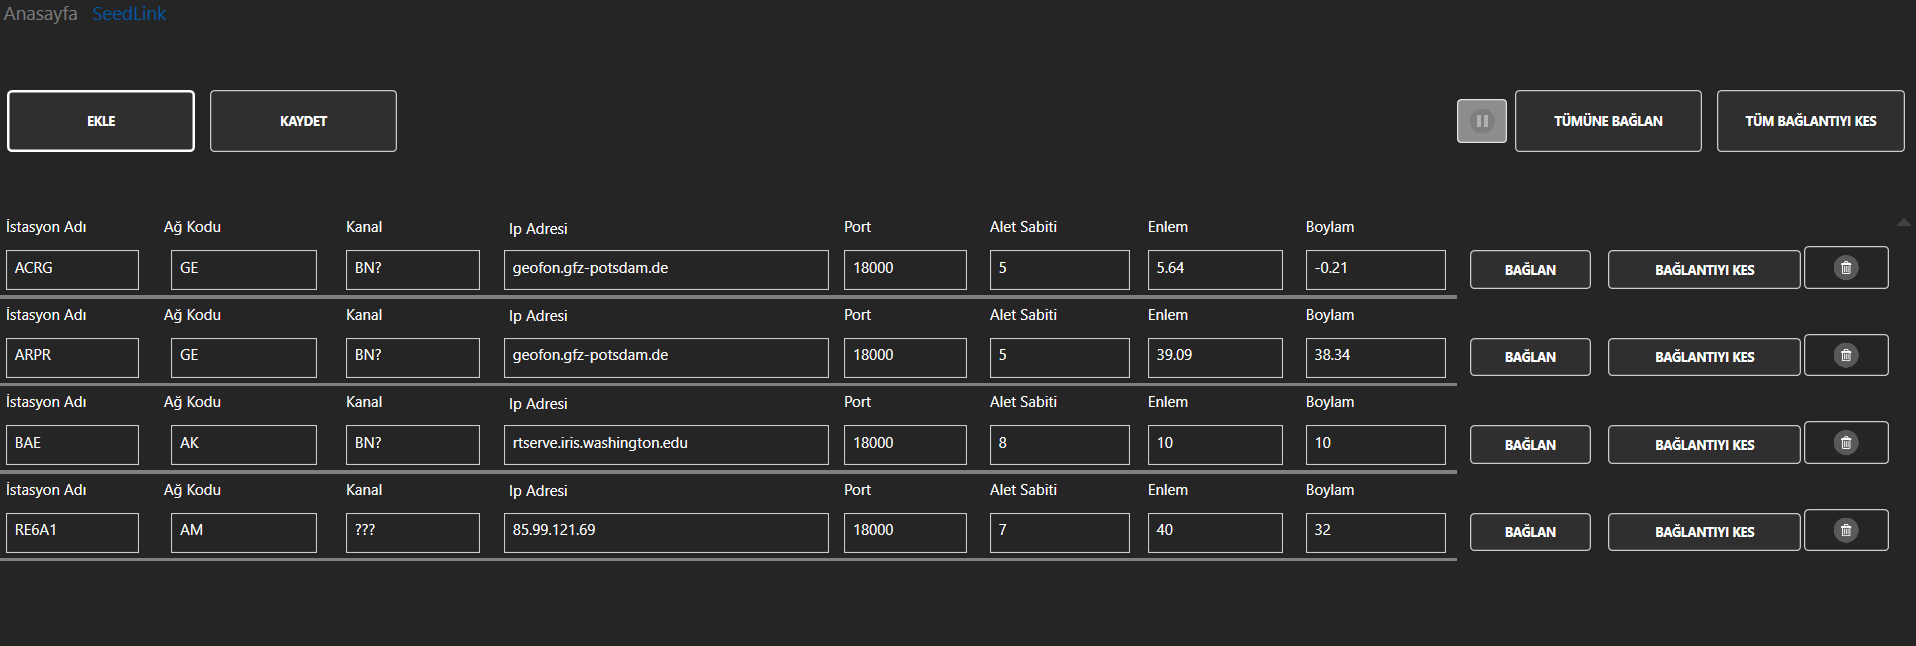
Adding new stations, sensors, channels has never been easier. All sensors can be connected simultaneously in a single session. Similarly, connections can be individually or collectively disconnected, and the stream can be stopped while it is ongoing. Seismer provides the capability to add virtually unlimited number of stations.
Real-Time Earthquake Monitoring
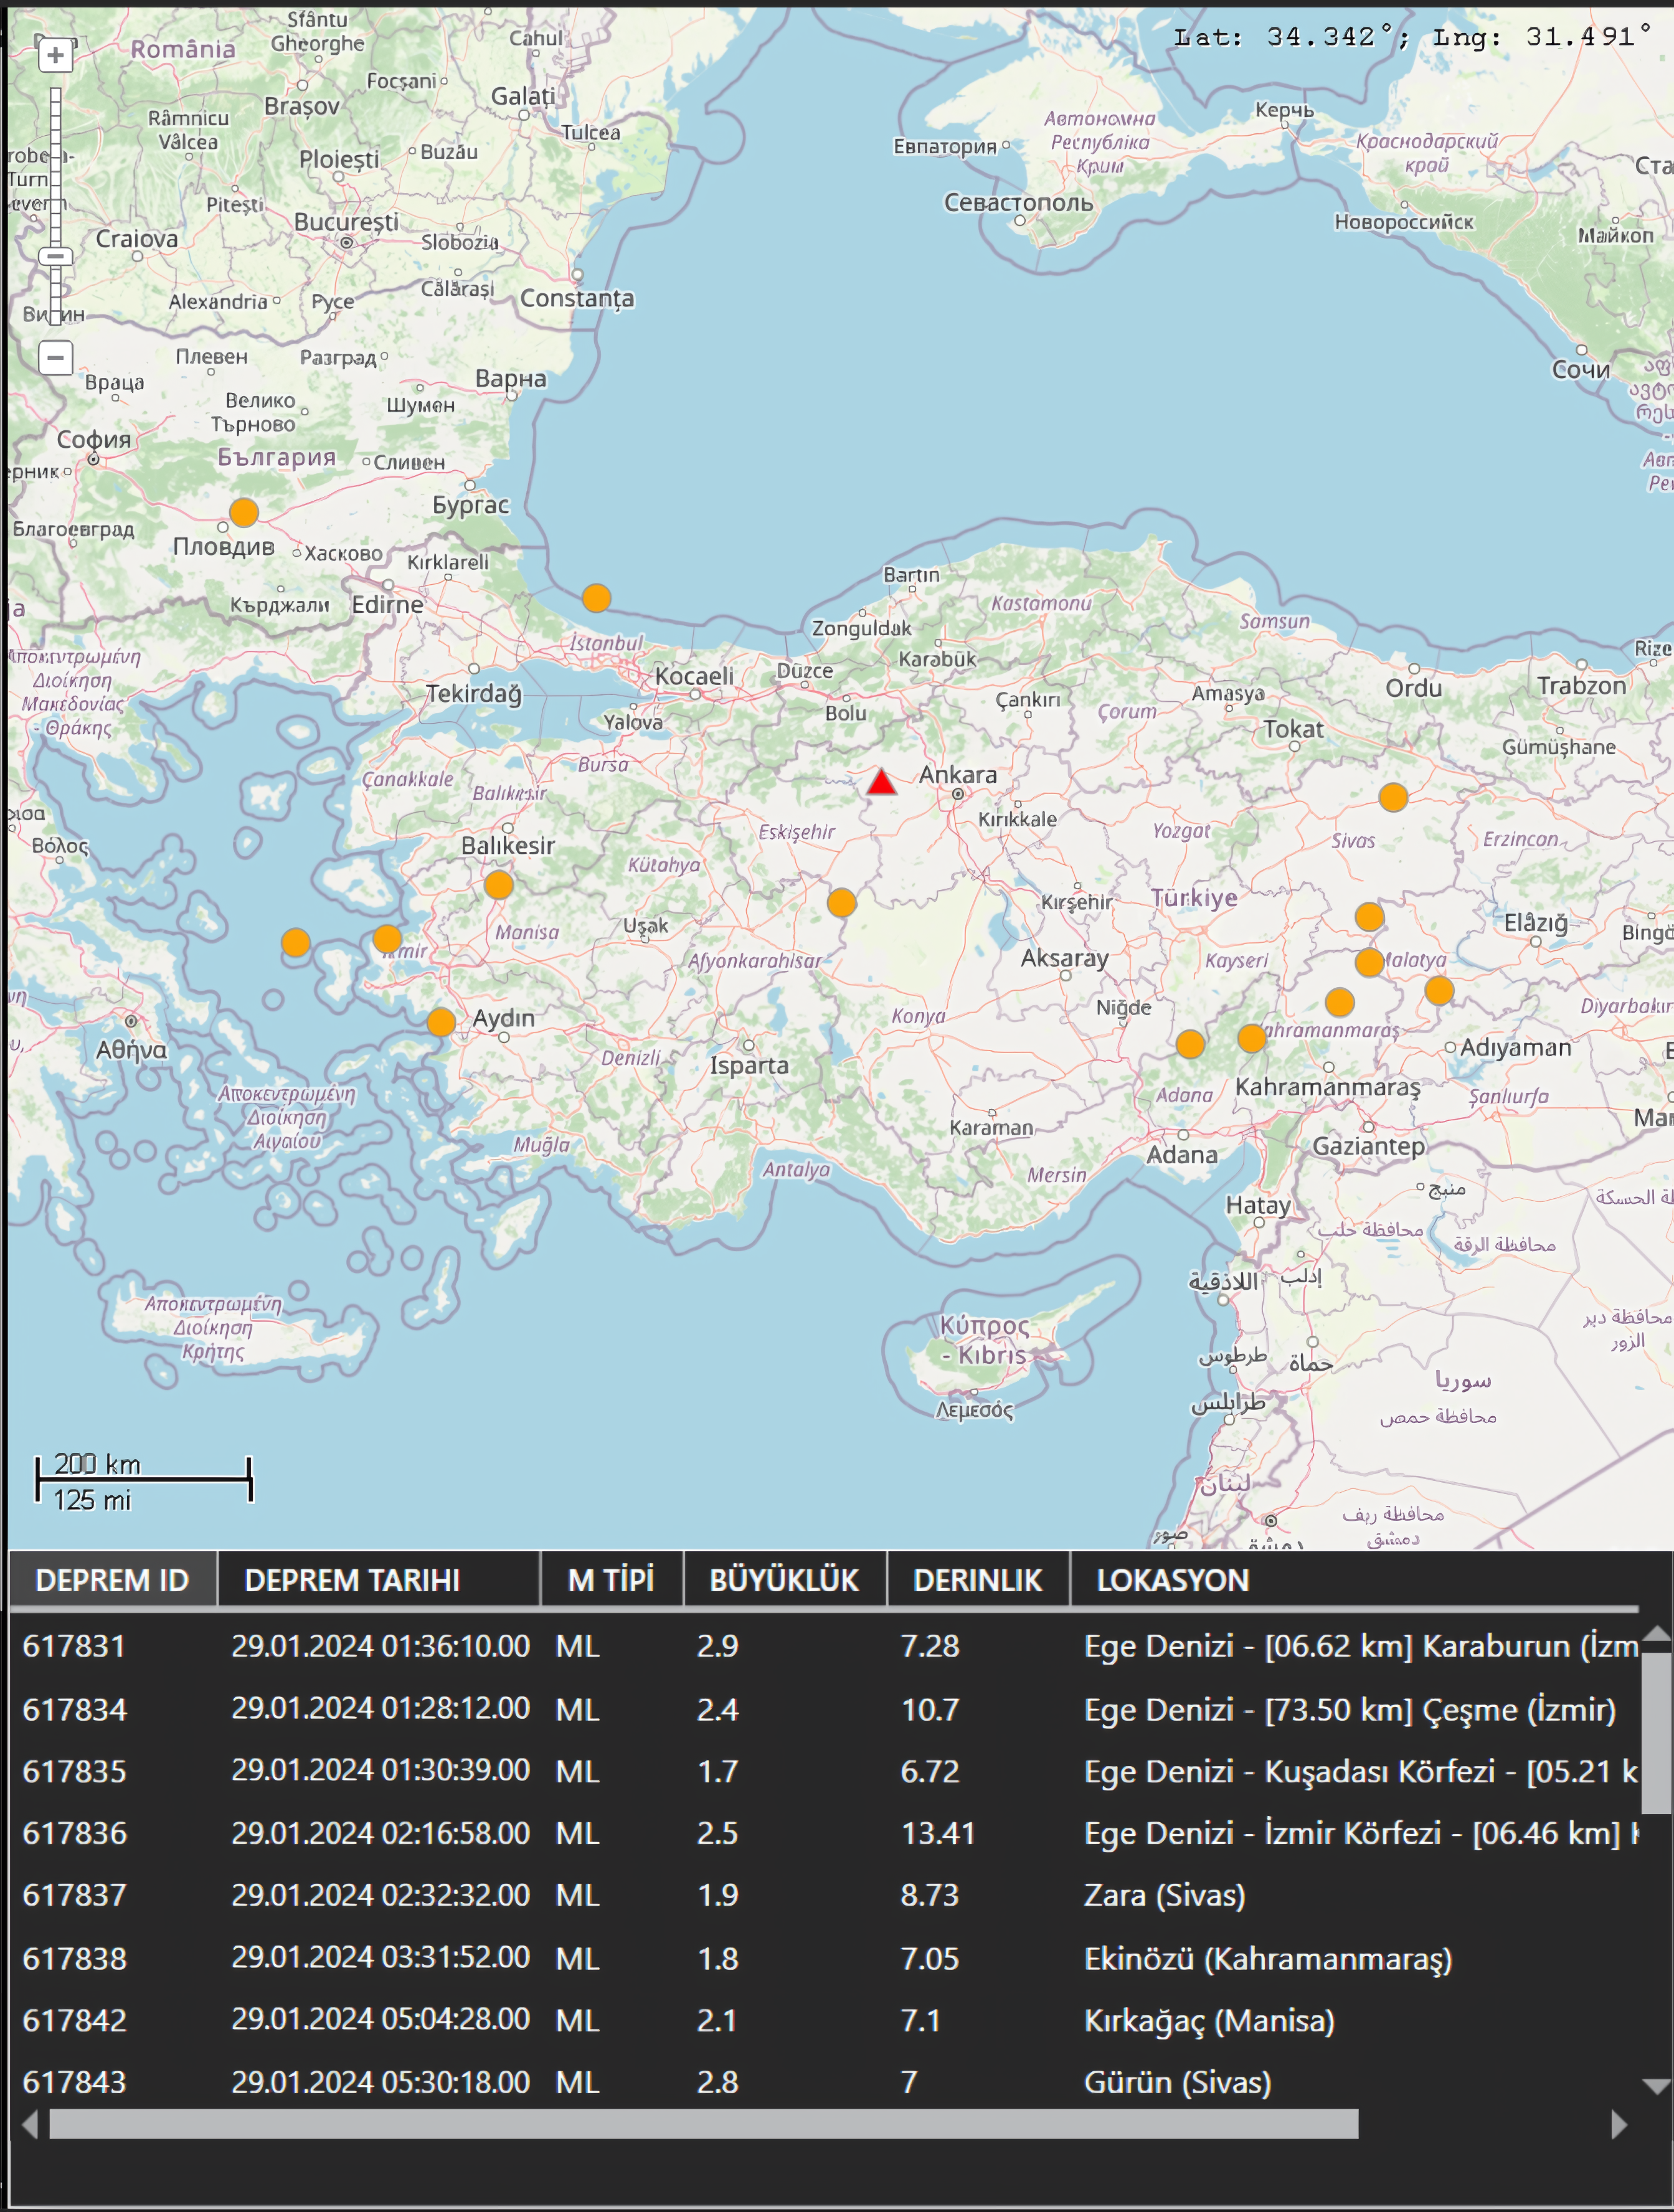
Earthquakes are monitored automatically from seismology centers. The earthquake locations and epicentral distance to the stations can be seen on map easily.
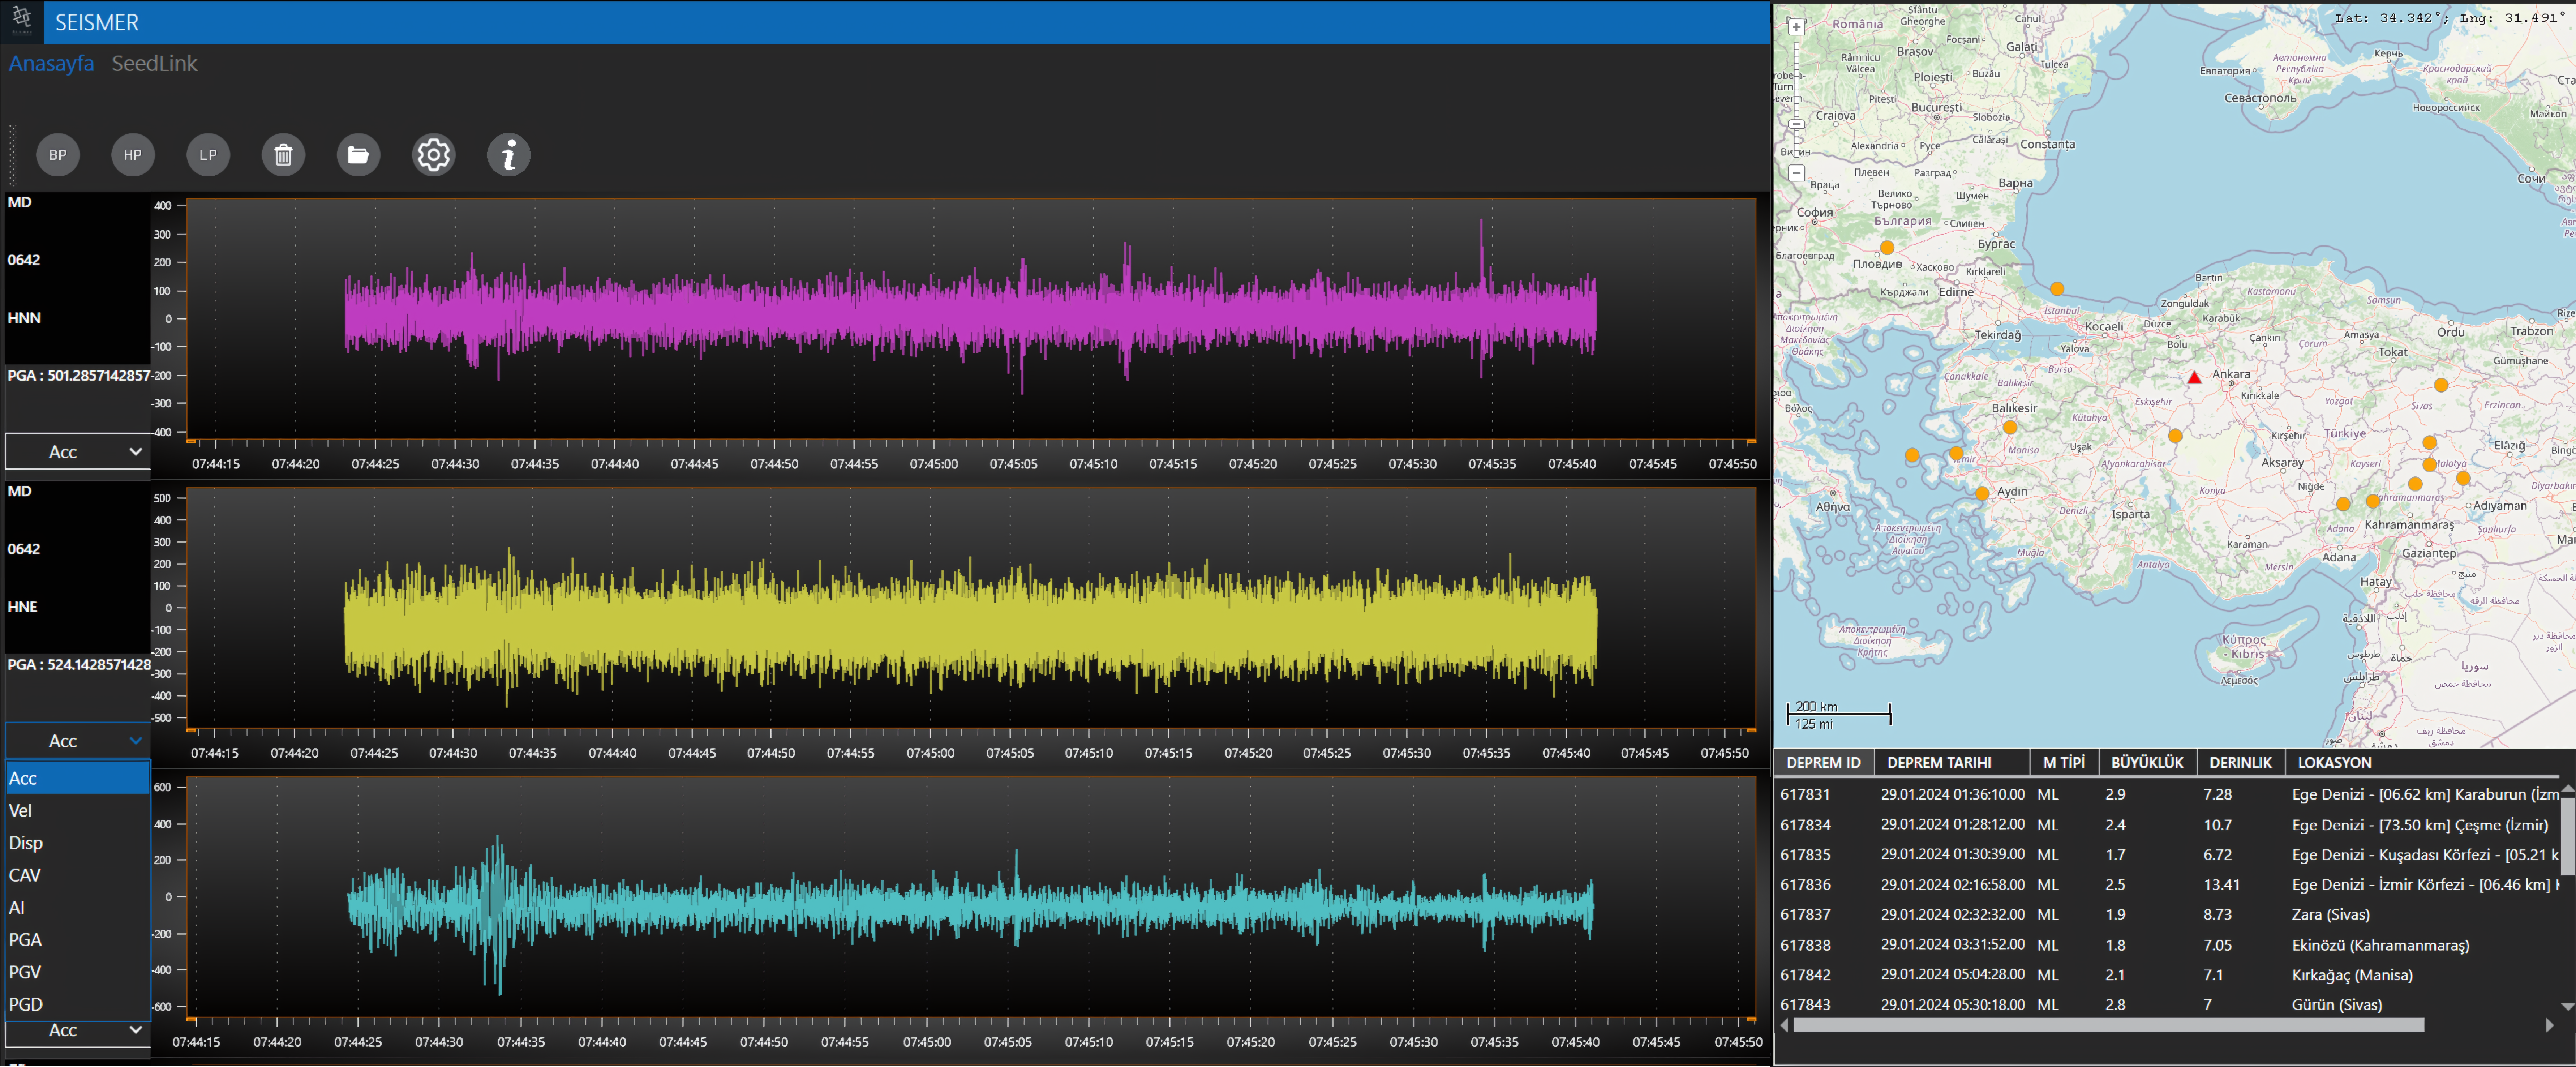
Through SeedLink, seismic signal data can be visualized in real-time within Seismer. By providing the IP address, port, station, and network code to Seismer, waveform data from sensors located anywhere in the world can be displayed instantly. Multiple data streams from different stations with different IPs can be visualized within a single flow.

Data recorded by Seismer can be viewed and analyzed any time. The acceleration, velocity, displacement, CAV (Cumulative Absolute Velocity), AI (Arias Intensity), PGA (Peak Ground Acceleration), PGV (Peak Ground Velocity), PGD (Peak Ground Displacement can be computed for past data. Thanks to the earthquake monitoring feature, the station data can be analyzed for specific earthquakes.
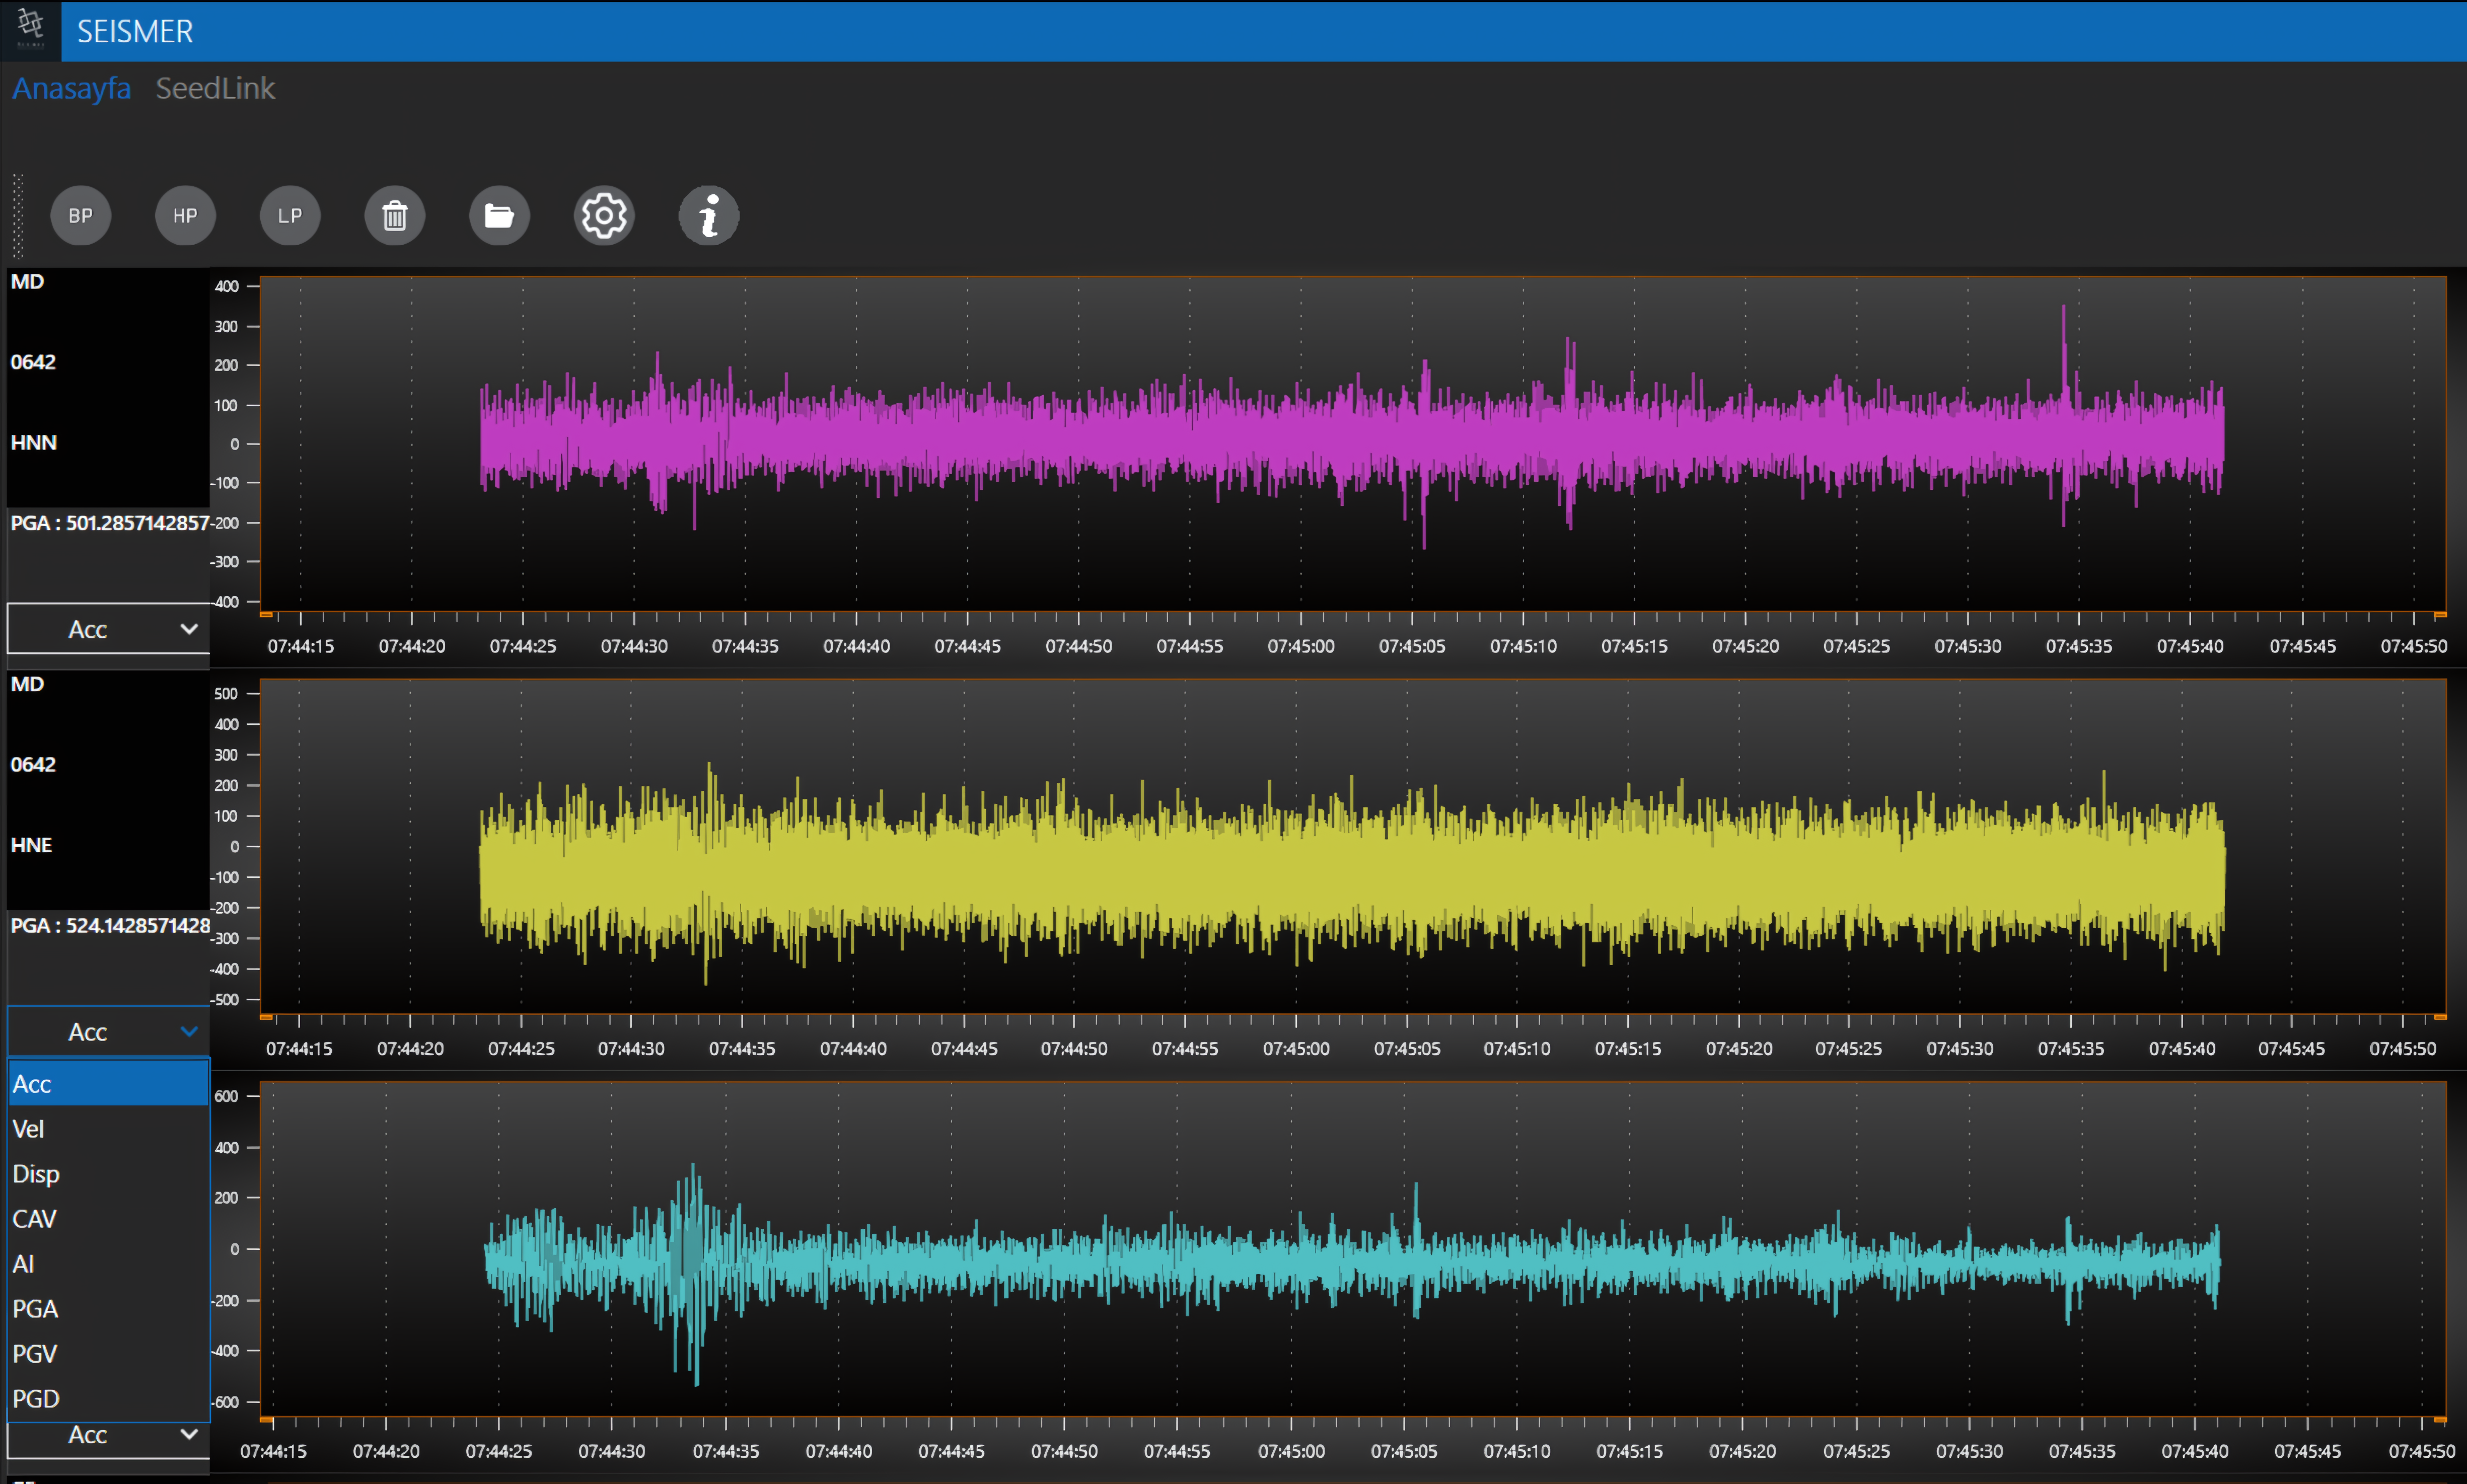
For accelerometers, the incoming data can be optionally visualized in the forms of acceleration, velocity, displacement, CAV (Cumulative Absolute Velocity), AI (Arias Intensity), PGA (Peak Ground Acceleration), PGV (Peak Ground Velocity), PGD (Peak Ground Displacement).
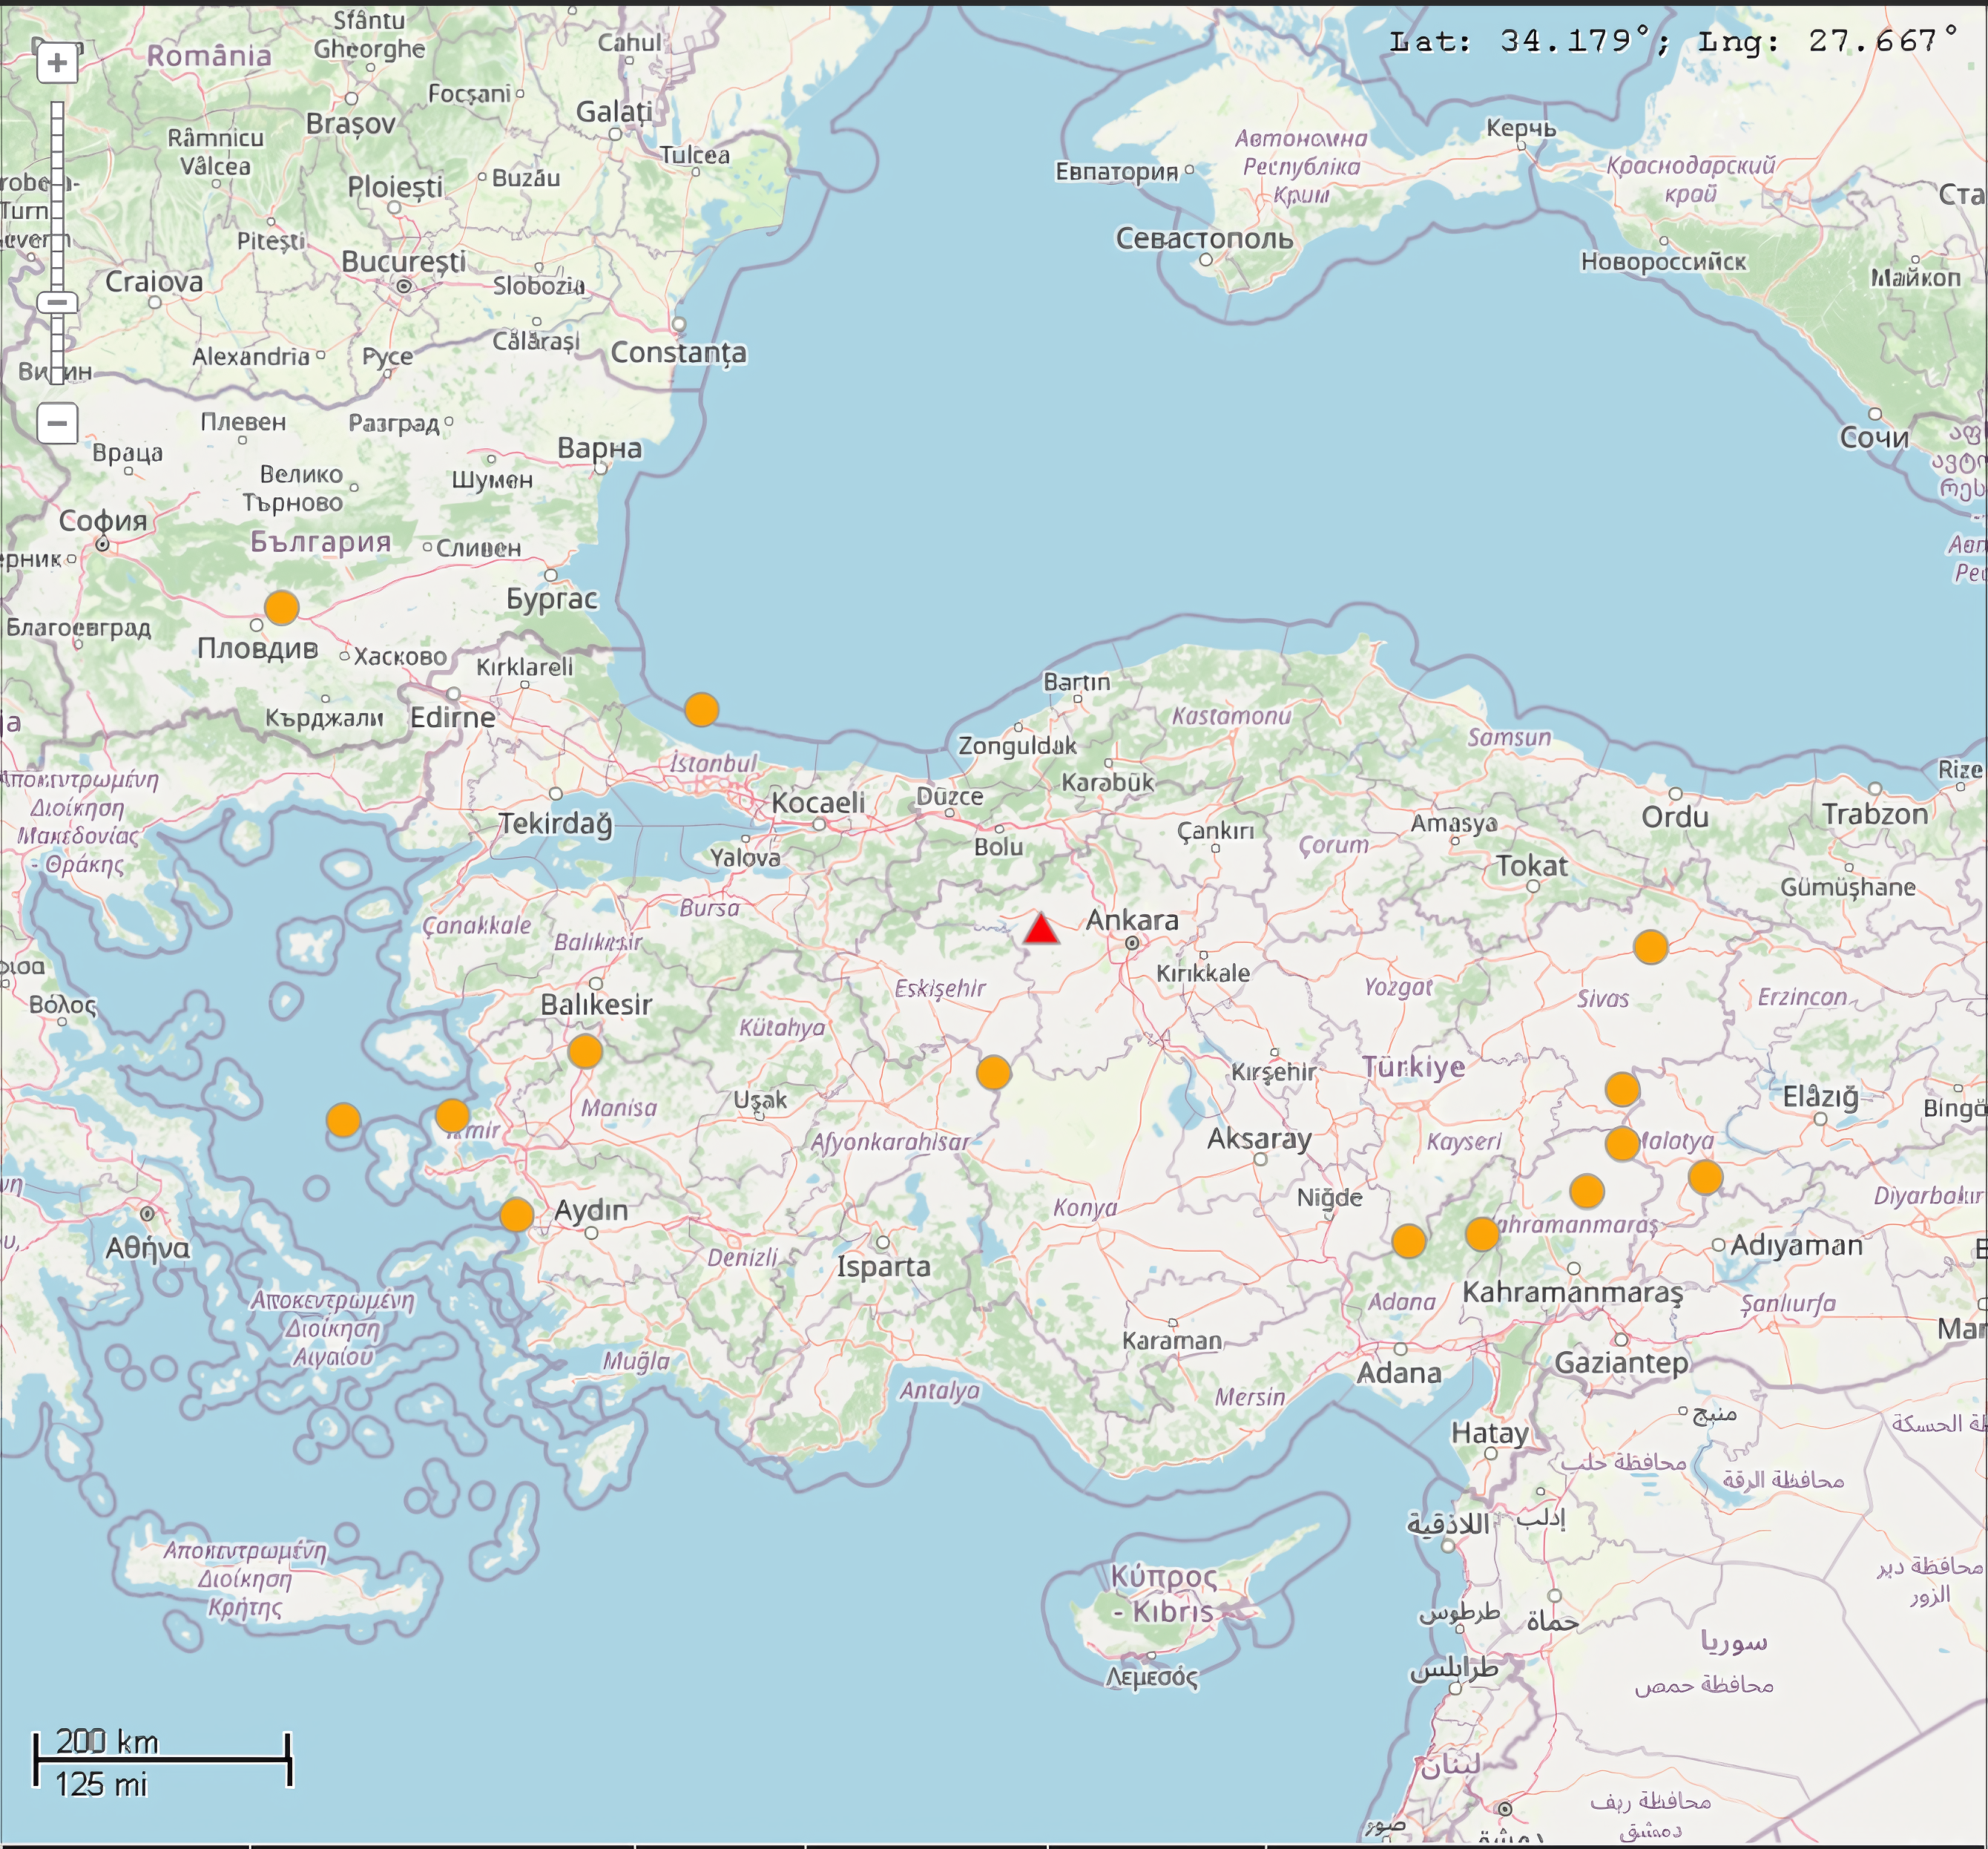
Earthquakes as well as the locations of the added stations are instantly added on the map. The online map template allows mouse-scroll zoom in/out and left-click panning. The waveform view and map view can further be enlarged or shrunk relatively for viewing on large screens.